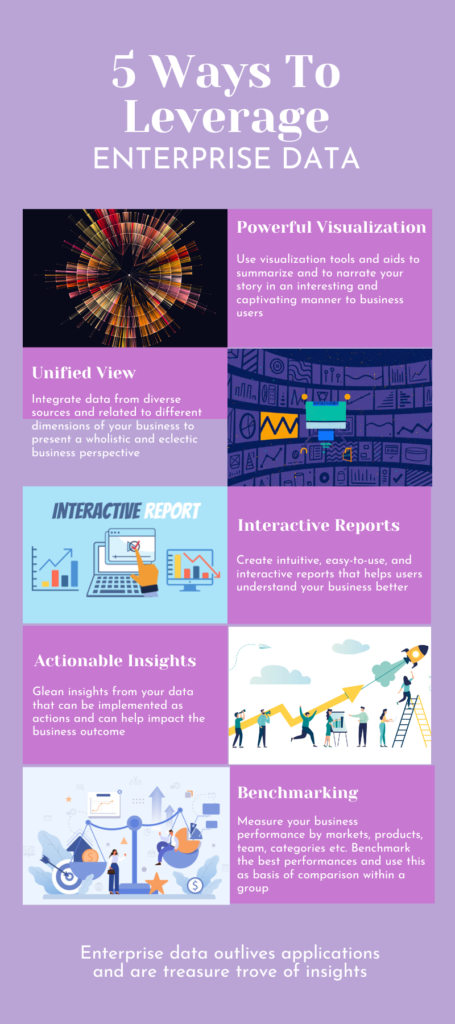
Enable Data Driven Decision Making
While organizations produce vast amount of data, they often are not meaningfully linked and kept out of decision-making process because of:
- Centralized data team, preventing mass understanding of data
- Difficulty to access high quality data, leading to drop in data usage
- Not knowing how to leverage data, causing apathy in data projects
- Security and Compliance concerns associated with data sharing
Our team of Power BI experts can help bring your data into center of business decision making by decentralizing access to reports and dashboard; integrating data from diverse sources; and powerful visualization
Our Data Analysis Samples
Here are some of our sample analyses from diverse functions and industries. We keep adding to the list regularly. So set up a request for demo and get access to all these analyses free of cost and for no obligation.
Manufacturing
View this analysis on garment industry to track, analyze the productivity performance of the working teams in the factories. Compare distribution of workers, idle workers and idle time across various teams. Also compare distribution of task time across various team and variation of task time over a period. Finally, see distribution of overtime and incentives across dates and teams.
Supply Chain
View this analysis which depicts information about a toy store – products, stores, daily sales transactions, and inventory level for each location. Through analysis additional dimensions such as rotation speed, profitability and stock level tiers were added. Using these dimensions, a visual story is created demonstrating which products are driving the biggest profits and their distribution across locations.
Ecommerce
This analysis is about an ecommerce site uncovering the correlation and patterns regarding the success of a product and the various components. This analysis shows how sensitive customers are to price drops. It also brings out the top category of product by sales, inventory and revenue. This analysis also captures the correlation between sale and product quality.
Retail
This analysis captures the consumer behavior of households which are catered to by a retailer. It links customer profile to average weekly spending. It also shows how purchase behavior is motivated by discounts. Furthermore, it captures linkage of sales to location, store hours and also advertising slots. Finally, it demonstrates the changes in spending patterns of customer over time and how is that related to customer demographics.
Related Topics
Why consider power BI over other business intelligence solutions
Microsoft has created quite a buzz in the BI space in the last 7 years with Power BI. What started as a self-service BI tool has over the years changed into a robust enterprise solution. In case your company has not made the decision for Power BI then read this blog to find out the top reasons why you should consider Power BI for data analytic and business intelligence.
Building a data centric culture to drive your digitalization story
Building a data centric culture means replacing gut feeling with data-derived facts. Decision makers are often required to generate ideas and formulate strategies. So, this means they need to understand the data and make sense of the culture that exists around the data. This blog delves into what is data centric culture and how can organizations build a data centric culture.
Get Started On Your Data Analytics Journey

Institutionalize understanding of data at all employee levels and build a data centric culture. Our team can help you spread this understanding of data in following ways:
- Set up your data analytics infrastructure using power BI, which is preferred platform for doing data analytics
- Identify business metrics that best captures your business goals
- Simplify the process of continuous tracking and measurement of the metrics
- Identify key reports critical to your business decision making
- Ensure smooth access to high quality data and analytics for your entire organization
- Help you with experimentation and testing before launching a new initiative
Contact us to further understand how we can help you make your data actionable
